
Occupancy Data Should Tell You More Than How Many People Walked In
For years, people-counting systems have focused on one basic question: How many people entered the location?
That number is important, but by itself it only tells part of the story. Modern businesses need to understand traffic patterns, conversion, performance, staffing requirements and what they should expect in the days and weeks ahead.
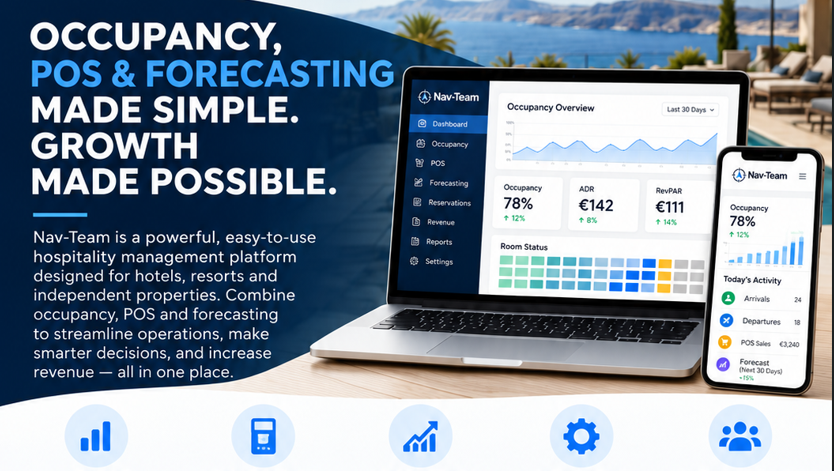
NAV Team is building a more complete occupancy and traffic analytics platform that brings multiple sources of information together in one place.
Real-Time Occupancy and Traffic Analytics
The foundation of the platform is accurate traffic data from entrance, occupancy and demographic sensors.
Managers can review traffic by location, entrance, zone or sensor and compare performance across daily, weekly, monthly and yearly periods.
Instead of simply seeing a total count, businesses can begin identifying:
- Peak traffic periods
- Daily and weekly traffic patterns
- Location-to-location performance differences
- Entrance and zone activity
- Historical traffic trends
- Unexpected increases or decreases in customer activity
Connect Traffic With POS Data
Foot traffic becomes significantly more valuable when it can be compared with Point-of-Sale data.
By connecting traffic and sales information, businesses can measure the relationship between customer visits and actual transactions.
This helps answer questions such as:
- How many visitors became customers?
- Which locations have the strongest conversion rates?
- Are sales increasing because of higher traffic or better conversion?
- Which hours generate the most revenue per visitor?
- Are staffing levels aligned with actual customer demand?
Traffic and POS data together create a clearer picture of store performance than either source can provide on its own.
Move From Reporting to Forecasting
Historical reports tell you what happened. Forecasting helps you prepare for what may happen next.
NAV Team is extending traditional occupancy reporting by combining historical traffic patterns with external factors that can influence customer activity.
Forecasting can take into account information such as:
- Previous daily and weekly traffic
- Seasonal patterns
- Local weather conditions and forecasts
- National and regional holidays
- Local events
- Historical performance for similar periods
The goal is to provide managers with an estimated traffic outlook that helps them make better decisions before customers arrive.
Better Staffing and Operations
One of the biggest benefits of accurate forecasting is workforce planning.
If a location knows that traffic is expected to be significantly above or below normal, management can adjust staffing, scheduling and operational resources accordingly.
That can help businesses reduce unnecessary labor costs while making sure enough employees are available during high-demand periods.
Built for Multi-Location Businesses
For organizations operating dozens or hundreds of locations, manually reviewing individual stores is no longer practical.
NAV Team provides centralized visibility across locations while still allowing users to drill down into individual sites, zones, entrances and sensors.
Regional and corporate teams can quickly identify locations that are performing differently from expectations and investigate the underlying data.
A More Complete View of Customer Traffic
The future of occupancy analytics is not simply counting visitors. It is combining traffic, sales, environmental information and historical performance into information managers can actually use.
NAV Team is focused on helping businesses move from:
Counting people → Understanding traffic → Measuring performance → Forecasting demand.
That means better visibility, better planning and better business decisions.
Learn More
To learn more about NAV Team occupancy analytics, traffic intelligence, POS integration and forecasting, visit www.nav-team.com.